
library(shiny)
n <- 1000
r <- .6
x <- rnorm(n)
y <- r*x + sqrt(1-r^2)*rnorm(n)
dat <- data.frame(x,y)

fit1 <- lm(y~x,data=dat)

plot(x,y,type="n")
coef.sim <- coef(sim(fit1))
for (i in 1:nrow(coef.sim)) {
  abline(a=coef.sim[i,1],b=coef.sim[i,2],col="gray50")
}
points(x,y)
abline(fit1)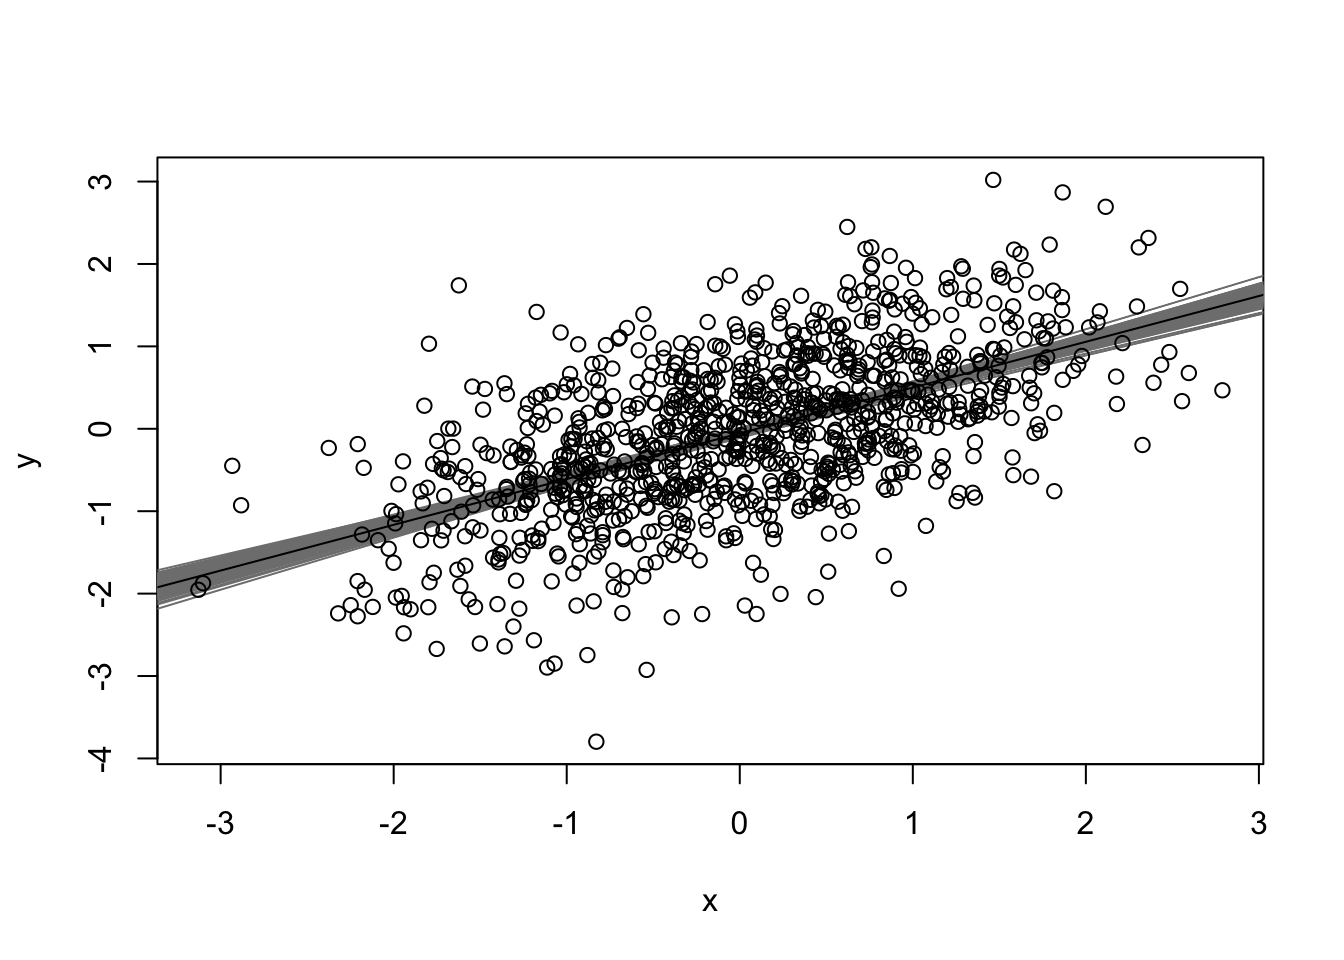
plot(coef.sim)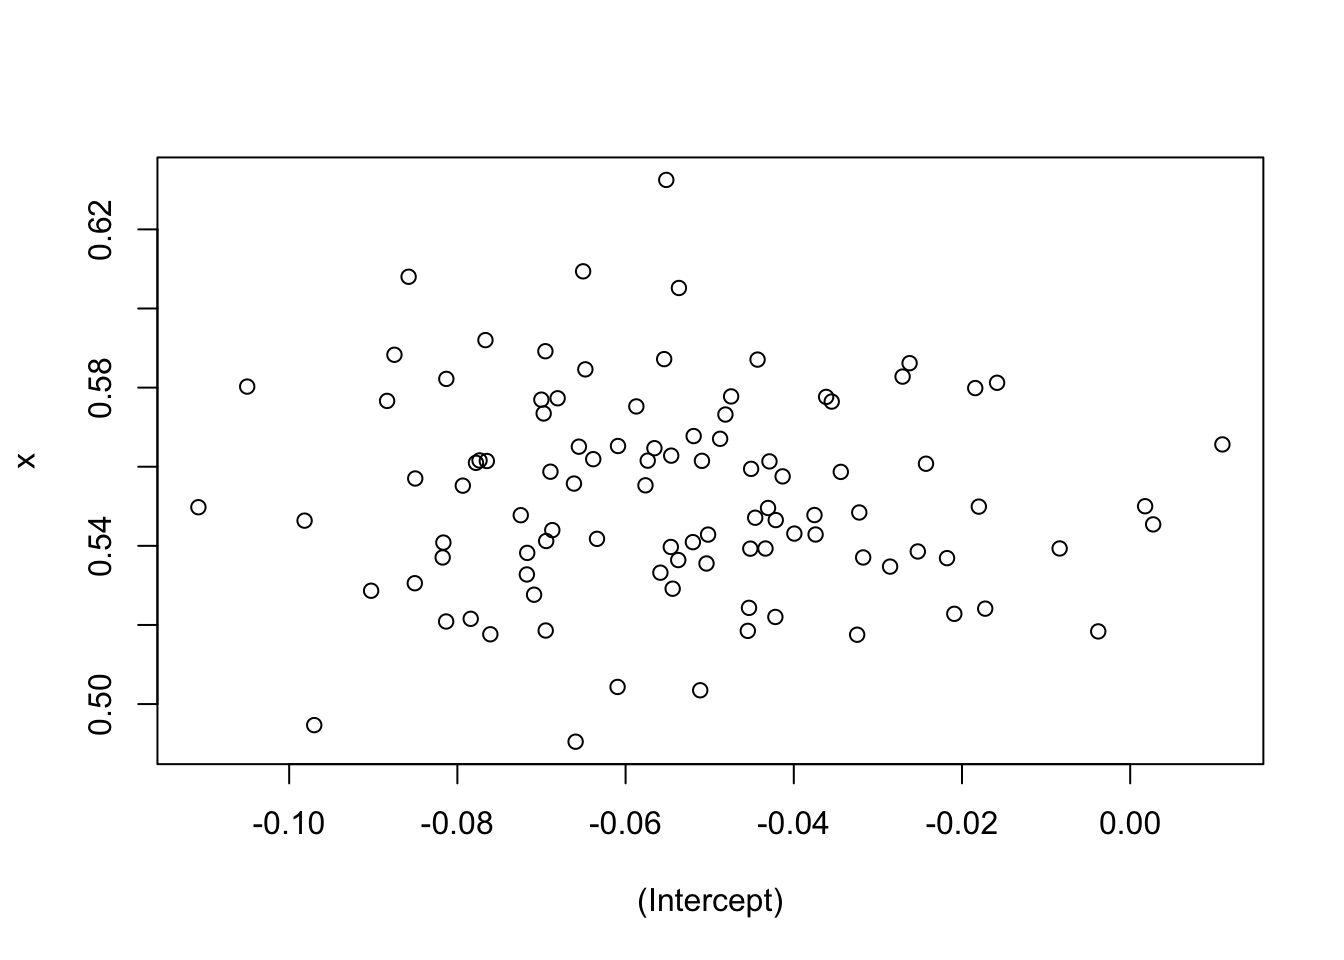
cor(coef.sim) (Intercept) x
(Intercept) 1.00000000 -0.04674892
x -0.04674892 1.00000000