The Actual and Adjusted CAPE Ratio, 1994-January 1, 2020
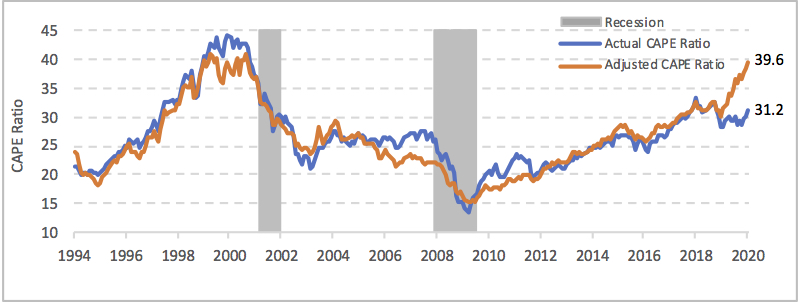 The actual and adjusted/predicted CAPE ratio from the paper
“Are Stock Prices High or Low?” As of January 1, 2020, the actual CAPE ratio is
lower than what the model predicts.
Gwartney-Connors Stock Market Monitor
The actual and adjusted/predicted CAPE ratio from the paper
“Are Stock Prices High or Low?” As of January 1, 2020, the actual CAPE ratio is
lower than what the model predicts.
Gwartney-Connors Stock Market Monitor
This monitor is designed to provide investors with information on the cyclically adjusted price-earnings
ratio (CAPE) of the S&P 500 compared to the projected CAPE. The CAPE was developed by Robert Shiller,
the 2013 Nobel prize winner. It is the ratio of the current price of a stock (or group of stocks) divided
by the inflation-adjusted earnings figures averaged over the past ten years. Because the CAPE is adjusted
for inflation and reflects earnings over a more lengthy time frame, it is a valuable indicator of how the
current price of a stock (or group of stocks) compares with earning potential.
The projected CAPE is derived from the following model: (1) the interest rate on five year Treasury bonds,
(2) the average growth of real GDP during the past five years, (3) the index of leading economic indicators,
(4) a short-term sentiment variable, and (5) a long term sentiment variable. The present value (expected
price) of any asset will reflect the discounted value of the stream of expected future earnings. This is
precisely what the five variables of the Gwartney-Connors model reflect. The explanatory power of the five
variables of our model is extremely high. The model explains 95 percent of the monthly variations in the
CAPE for the S&P 500 since 1965.
The projected value of the CAPE for the S&P 500 can be compared with the actual value of the CAPE. When
the projected value of the CAPE is high compared to the actual CAPE, the model indicates that current
stock prices are cheap. In contrast, when the actual value of the CAPE is greater than the projected CAPE, the
model indicates that current stock prices are expensive. The greater the under-valuation (or over-valuation),
the greater the probability that stock prices will rise (decline) in the near future. The model is updated at
the end of the first business day of each month and the projected CAPE for the S&P 500 presented along with
the actual CAPE on this website. The latest figures for the past 12 months are presented here.
| Actual | Predicted | Actual–Predicted | Standardized |
|---|
| Date | CAPE Ratio | CAPE Ratio | GCIndex | GCIndex* |
|---|
| Jan 1, 2020 | 31.23 | 39.62 | -8.39 | -4.26 |
| Dec 1, 2019 | 30.29 | 38.36 | -8.07 | -4.10 |
| Nov 1, 2019 | 29.91 | 37.87 | -7.96 | -4.05 |
| Oct 1, 2019 | 28.84 | 36.60 | -7.76 | -3.94 |
| Sep 1, 2019 | 29.23 | 37.47 | -8.24 | -4.19 |
| Aug 1, 2019 | 28.70 | 35.84 | -7.14 | -3.63 |
| Jul 1, 2019 | 29.99 | 36.59 | -6.60 | -3.36 |
| Jun 1, 2019 | 29.28 | 34.92 | -5.64 | -2.88 |
| May 1, 2019 | 29.24 | 33.63 | -4.39 | -2.25 |
| Apr 1, 2019 | 30.13 | 34.11 | -3.98 | -2.04 |
| Mar 1, 2019 | 29.58 | 32.34 | -2.76 | -1.43 |
| Feb 1, 2019 | 29.54 | 32.05 | -2.51 | -1.31 |
Note: *The standardized GCIndex is simply the standardized transformation of the
actual CAPE ratio minus the predicted CAPE ratio.
Click here to download the full adjusted CAPE ratio table (.xlsx file).
Additional information on the future of stock prices
As our model indicates, changes in interest rates, expectations of future corporate earnings,
inflation, and market sentiment exert a major impact on stock prices. Here, we will consider
both unfavorable and favorable factors that will tend to move stock prices in the future.
Unfavorable Factors
- Rising Interest Rates. Increases in government spending, large budget
deficits even though the economy is strong, higher than expected increases in the CPI during recent months, and
an apparent pick up in private investment are all placing upward pressure on interest rates. Between August 2017
and February 2018, the interest rate on the five-year Treasury bond increased by 80 basis points. The interest
rate on the ten-year bond rose by a similar amount. As our model indicates, when interest rates rise, there will
be a strong adverse impact on stock prices.
- Higher Inflation Rate. As interest rates rise, the velocity of money
(the number of times a dollar is used to purchase things during a year) will increase. In response to the 2008
recession, the Fed increased the supply of money rapidly. But, the impact on inflation was minimal because of
the declining velocity of money in the face of low interest rates. The velocity of money tends to increase as
financial advancements make it easier for people to conduct their business activities with smaller money balances.
This was the case year after year during the 1980s, 1990s, and during the early years of this century. By 2007,
the velocity of the M1 money supply had increased to 10, twice the figure of two decades earlier. As the Fed
increased the money supply substantially during and following the recession of 2008-2009, interest rates fell to
near zero and, as the result, the velocity of money fell to less than 6, 40 percent below the level of 2007.
However, the velocity of money, both M1 and M2, are highly sensitive to interest rates. As interest rates rise,
the opportunity cost of holding money will rise, which will cause the velocity of money to increase. When this
happens, there will be upward pressure on prices and the inflation rate will rise. Moreover, there is not much
the Fed can do to offset this problem in the short-term, because the money has already been injected into the
system. If the Fed shifts to a more restrictive monetary policy to fight inflation, the initial impact will be
higher interest rates and a further increase in the velocity of money. This combination of factors—higher
interest rates, increases in the velocity of money, and inflation—will be bad for stock prices.
- Trade Restrictions. Exchange, including international trade, is a positive
sum game; unless both trading partners gain, the exchange will not occur. Trade makes it possible for the trading
partners to produce a larger output and consume a more diverse bundle of goods than would otherwise be possible.
The Trump Administration ran on a platform of trade restrictions. Their recent actions on washing machines, solar
panels, steel, and aluminum indicate they are serious about going down this path. The restrictions may help a few
industries, but the costs will always outweigh the benefits. They will harm consumers, stifle gains from trade,
cripple U.S. export industries, and encourage political cronyism. They will also lead to retaliation, further
enlarging their damage. For example, China has already filed a complaint with the WTO, stating that American
exporters have been selling grain below cost as a result of U.S. farm subsidies. As our experience with the Smoot-Hawley
trade bill of 1930 indicates, large scale trade restrictions will be a disaster for both the U.S. economy and the
stock market. Additional actions in this area constitute an imminent threat to both the economic expansion and recent
gains in stock prices.
- Length of Current Expansion. The current expansion started in July of 2009
and it is now close to the longest in American history. It is unlikely that it will continue much longer without a
recessionary slowdown. When the economy weakens, the growth of corporate earnings will also slow, which will be bad
for stock prices. The index of leading indicators, one of the variables in our model, is designed to provide an early
warning of when this is likely to happen. Investors need to keep a close eye on this index in the days immediately ahead.
Favorable Factors
- Composition of the Population In High-Income Countries. Interest rates are
determined in world financial markets. Currently, a large and increasing share of the population in Japan, western Europe,
and other high-income countries is in age groupings (e.g. 50 to 70 years) during which people are likely to be net lenders
and a small and declining share in age groupings (e. g. 20 to 50 years) during which people tend to borrow heavily. These
demographic changes increase the supply of and reduce the demand for loanable funds, placing downward pressure on interest
rates. These factors have contributed to the low interest rates throughout the world in recent years. The direction of these
demographic changes in the high-income countries will continue for at least another decade. This will help to moderate
upward pressure on interest rates in the years immediately ahead.
- Corporate Tax Rate Reduction. The recent reduction in
the corporate tax rate in the United States from 35 percent to 21 percent will increase the incentive of firms to produce
and expand employment and to reinvest in future company growth. This is positive for both future net earnings and stock
prices. Because there has been only a few rate reductions of this magnitude in the United States and other high-income
countries, it is difficult to estimate the precise impact of this factor on stock prices.
- Stimulus From Recent Passage of Spending Increases. The recent budget agreement has
authorized substantial spending increases for both national defense and domestic programs. Further increases in government
spending for infrastructure programs appear likely. These spending increases are financed almost entirely through borrowing
and expansion in the federal debt. Keynesian economics indicates such spending will increase total demand and boost future
corporate earnings. To the extent this happens, it would be good for the stock market. However, there is disagreement among
economists about the potency of deficit financing. Moreover, given that the economy is currently at or near full employment,
the spending increases are likely to exert only a modest impact on real output, employment, and corporate earnings. This
suggests it would be risky to expect a strong positive impact as the result of this factor.
Note:
This information was developed by James Gwartney and Joseph Connors solely for the benefit
of those who follow our stock market monitor. We are economists and independent analysts. We are not associated with any
investment or brokerage firm. While we believe investors will find the information of value, it is not a recommendation or a
solicitation to buy or sell securities or any other investment vehicle.
Working Papers
“Are Stock Prices High or Low?” Joseph Connors and James Gwartney, draft 6/21/2017.
Data Appendix for “Are Stock Prices High or Low?”

